Introduction to Reconciliation Summary
Cointab’s Reconciliation Summary simplifies and enhances the way you manage and monitor your financial reconciliation. This feature is specifically designed to offer users a comprehensive view of their reconciliation process, providing clear insights into reconciliation history and efficiency, all within a seamless and easy-to-use interface.
With the Reconciliation Summary, businesses gain unmatched transparency and control over their financial data. It’s an essential tool for improving accuracy, streamlining reconciliation workflows, and resolving discrepancies quickly. Plus, with a 30-day free trial, you can explore all the benefits risk-free.
Buckets:
Organized Data for Targeted Analysis
Buckets are user-defined sections of data that organize and categorize reconciliation information based on criteria like transaction type, amount differences, or time frames. By segmenting data into meaningful subsets, buckets make critical information easily accessible and actionable, enabling users to identify trends, address discrepancies, and make informed decisions. With in-depth insights, effortless navigation of historical data, and clear graphical representations, buckets streamline the reconciliation process, enhance compliance, and support data-driven financial decision-making.
Key Features of Reconciliation Summary
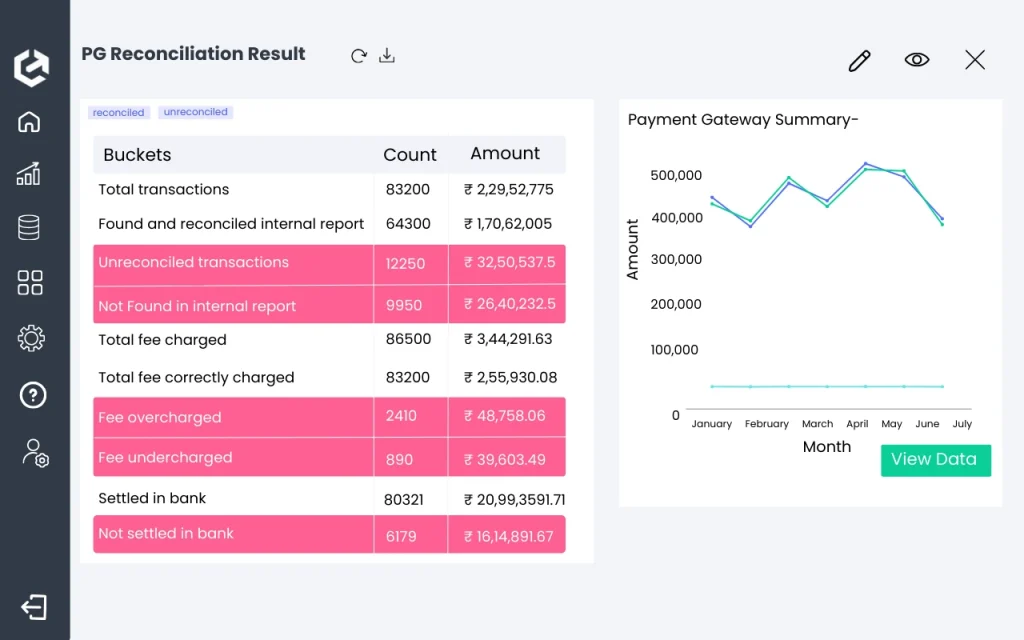
Buckets Overview
- The dashboard presents reconciliation data in a tabular format, displaying the bucket name, transaction count, and amount under each bucket. This provides a clear overview of the reconciliation status, categorized by different reconciliation types.
Visual Analytics
- By selecting a particular bucket, users can view the data in a graphical format for the selected time period. This visual representation makes it easier to understand trends and patterns at a glance.
Detailed Data Access
- For users who want a deeper dive into the data, the "View Data" option provides detailed information on each bucket, allowing users to investigate the specifics of any transaction or category.
Intervention Highlights
- The dashboard highlights the buckets that require user intervention, ensuring that no issues are overlooked.
Tags
- Users can apply tags to view data specific to certain buckets, making it easier to focus on particular segments of reconciliation.
Filtering by Date
- The data can be filtered based on the transaction date, invoice date, shipping date, or payment date. This filter option is available via a dropdown.
Use Cases Across Departments and Industries
EdTech
- Streamlines the reconciliation of student payments, refunds, and financial aid disbursements.
- Provides detailed insights into tuition fee collections and any discrepancies in student billing.
SaaS
- Tracks subscription payments, renewals, and cancellations for seamless financial reporting.
- Helps reconcile billing data against customer usage metrics to ensure accuracy in invoicing.
Logistics
- Reconciles transportation and shipping expenses, ensuring accurate cost allocations.
- Tracks discrepancies in invoices from suppliers and third-party providers for better financial oversight.
Banks
- Monitors account balances and transaction data to ensure accurate reconciliation of customer accounts.
- Identifies discrepancies between internal records and external transactions, such as payments or transfers.
E-commerce
- Reconciles customer payments, refunds, and returns to ensure accuracy in financial statements.
- Tracks discrepancies between orders, payments, and inventory to reduce financial errors.
Healthcare
- Ensures accuracy in reconciling insurance claims and patient billing data.
- Helps track payments, reimbursements, and discrepancies in medical billing for better financial management.
Discover How Source Data Automation Can Enhance Your Workflow. Book a Demo!
How the Universal Search Feature Works
Step 1: Data Categorization
Users set specific criteria to categorize reconciliation data into distinct buckets based on attributes like transaction type, amount differences, or date ranges.
Step 2: Data Overview
The dashboard presents reconciliation data in a tabular format, displaying the bucket name, transaction count, and amount for each category, offering a quick snapshot of the reconciliation status.
Step 3: Graphical Analysis
Once a bucket is selected, users can view a graphical representation of the data for a specified time period, helping to identify trends and patterns easily.
Step 4: Detailed Exploration
For deeper analysis, users can access detailed information by clicking on the “View Data” option, diving into the specifics of each transaction or bucket.
Step 5: Intervention Flags
The dashboard automatically highlights buckets requiring user intervention, ensuring that no discrepancies are overlooked.
Step 6: Data Filtering and Tags
Users can filter data based on transaction, invoice, or payment dates, and apply tags to narrow the view to specific categories or timeframes.
Step 7: Downloadable Reports
After analysis, users can download detailed reports in both PDF and Excel formats, including the graphical data, for further review or sharing.

“Companies with structured data management processes see a 40% reduction in operational costs.”
– Tech Efficiency Study, 2023
Why Choose Cointab's Reconciliation Summary Feature?
Cointab's Reconciliation Summary feature is the ultimate tool for businesses looking to simplify complex reconciliations. With its robust capabilities and user-friendly design, it ensures that you stay in control of your financial data and processes. Whether you’re a small business or a large enterprise, this feature is tailored to meet your needs, helping both operational teams and leadership achieve greater efficiency and accuracy.
Additional Highlights
- Tabular Data View: In addition to the graphical representation, users can also view the data in a tabular format, arranged day-wise for better clarity and detail.
- Zoom Functionality: To gain a deeper understanding of trends and fluctuations, users can zoom in or zoom out on the graphs, allowing for a more granular or broader view of the data.
- Download Reports: Users can download detailed reports along with the graphs in both PDF and Excel formats. This functionality ensures that users have the necessary tools for reporting, sharing, or further analysis.
")
Benefits for Your Organization
For Analysts
- Comprehensive Data Overview: Displays reconciliation data in a tabular format with bucket name, count, and amount for easy analysis.
- Deep Data Access: “View Data” option allows users to explore detailed information for each bucket and category.
- Flexible Data Filtering: Users can filter data by transaction, invoice, shipping, or payment dates for precise analysis.
For Managers
- Visual Trend Insights: Graphical representation helps users identify trends and patterns for selected time periods.
- Prioritized Intervention: Highlights buckets requiring user intervention, ensuring critical issues are addressed promptly.
- Report Downloading: Download detailed reports with graphs in PDF and Excel formats for sharing and further analysis.
For Leadership Teams
- High-Level Data Summarization: Provides an executive overview of reconciliation status, helping leadership make informed strategic decisions.
- Decision-Making Support: Empowers leadership with real-time data to make quicker and more accurate decisions.
- Streamlined Workflow: Optimizes processes by providing clear insights, making it easier to align teams and improve operational efficiency.